A Small Pipeline, With Explicit Boundaries: Architecture & Implementation
Model choices, orchestration, structured outputs, evaluation, and the production trade-offs I haven't measured yet.

AI Waiter started with a focused goal: generate synthetic restaurant customer–waiter interactions that could be inspected, labeled, and evaluated—not just plausible-looking text. I wanted to experiment with data quality and the reliability of an LLM judge without building a large platform around the experiment.
The result is a Python pipeline that uses OpenRouter's OpenAI-compatible API, structured outputs, local JSON artifacts, human labels, and an LLM-as-judge stage.
Repository: aiwaiter-synthetic-data-generator
1. The problem
A useful synthetic example needs more than a question and a fluent answer. It needs consistent fields for the scenario, menu items, service steps, safety information, and practical tips. Those fields also need to be evaluated independently: an answer can sound good while giving vague safety guidance or irrelevant advice.
I organized the generator around five restaurant categories, including dietary restrictions and allergies, order customization, and service recovery. Each item follows a shared schema, and six quality dimensions are used for both human labeling and judge scoring.
The aim is not to simulate a production waiter end to end. It's to build a repeatable dataset-generation and evaluation workflow that makes quality problems visible.
2. The initial approach
I kept the architecture deliberately simple: one orchestrator, separate modules for each stage, versioned prompt files, and JSON artifacts between stages.
Generate → Validate → Human labels → LLM judge → Analyze
The stages are dispatched by pipeline.py. Generation lives in step1_generation.py; the judge is implemented in step4_llm_as_judge.py; and step5_analysis_visualization.py calculates per-dimension metrics and writes visualizations.
For the generator, I chose meta-llama/llama-3.1-8b-instruct; for the judge, openai/gpt-oss-20b. Both are configured in config.py and accessed through OpenRouter's OpenAI-compatible client. This is a practical experiment setup—not a claim that these are the best models for production.
I used Instructor with Pydantic models to request and validate a structured QADataset, rather than trusting the model to return parseable JSON by prompt instruction alone. The schema is defined in step1_generation.py.
3. What went wrong
Two problems exposed the difference between a pipeline that runs and one that produces useful evidence.
First, structured output was not guaranteed just because the judge was asked for structured verdicts. During an early run, the new judge returned verdict objects with a pass field but no rationale, while the expected schema required pass_ and rationale. Validation failed and retries were exhausted before a Step 4 result file was written. I recorded that failure in iteration-log.md.
Second, the baseline judge was too vague about what counted as a failure. On the fixed 42-example evaluation set, agreement with the human reference labels was only 70.2% on average. Safety specificity was just 9.5%, and tip usefulness was 42.9%. The problem wasn't orchestration or API connectivity; it was that the rubric encouraged inconsistent judgments.
That distinction mattered: adding retries would not fix an ambiguous evaluation rule.
4. The iterations
I kept the pipeline stages separate so I could change the judge rubric without regenerating the examples. The command-line interface selects prompt versions explicitly:
python3 pipeline.py step4 --generator-prompt=v1 --judge-prompt=v3
The generated dataset and human labels remain separate artifacts from the judge output. Step 5 merges them by trace_id, then calculates pass rates and agreement. See the output conventions and run examples in the README.
The rubric changed in response to individual disagreements. For example, the v3 safety_specificity criteria allow a safety note to pass when it ties a risk or precaution to the actual order, and not only when it names a specific allergen. The point was to describe observable evidence, with edge cases, rather than tell the judge to “be strict.”
5. Results—and what the charts show
Across the same 42 examples, mean agreement rose from 70.2% at baseline to 96.0% with judge prompt v3. Safety specificity rose from 9.5% to 90.5%; tip usefulness rose from 42.9% to 88.1%. One iteration also caused answer completeness to regress before a clearer direct-answer rule brought it back up. The iteration log documents those trade-offs rather than only the final score.
Figure 1 — Final agreement by quality dimension
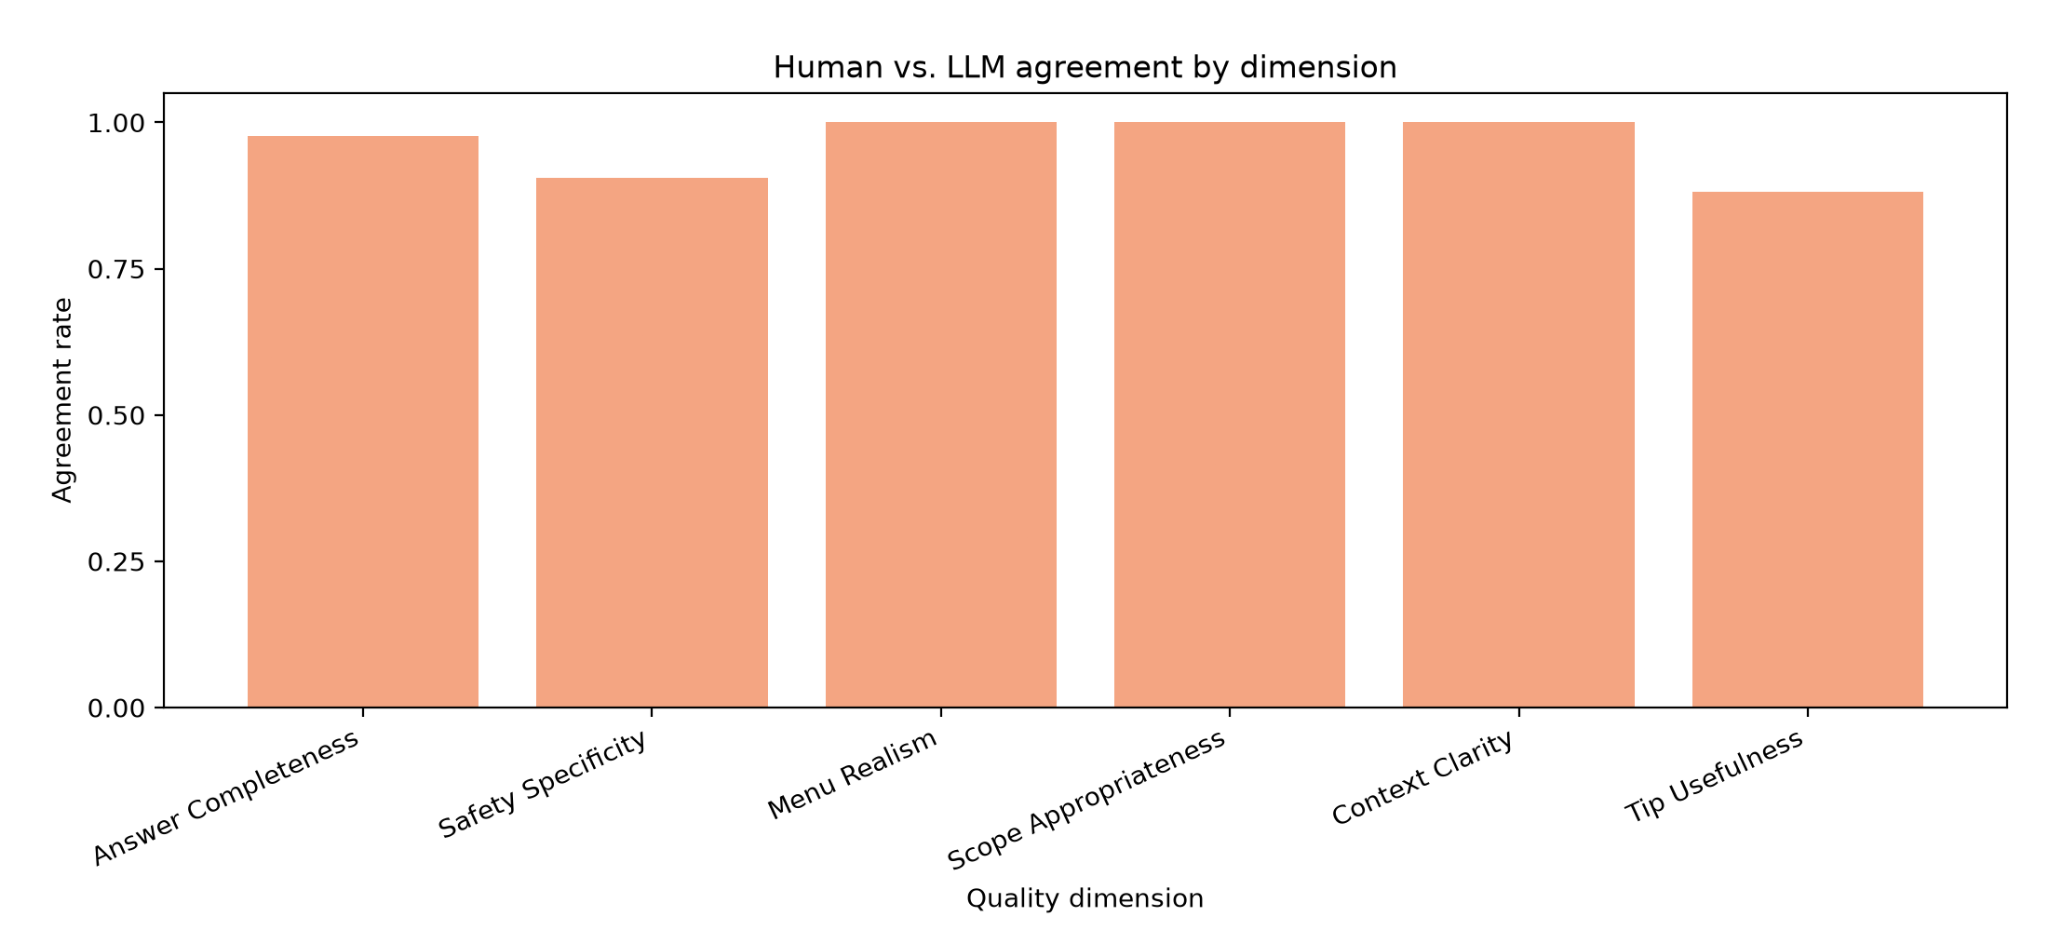
This is the cleanest summary view for the final judge setup. It shows that menu_realism, scope_appropriateness, and context_clarity reached perfect agreement on this evaluation set, while safety_specificity and tip_usefulness remained the lowest dimensions even after the judge prompt improved. That's useful because it tells me where the pipeline still needs attention.
Figure 2 — Human vs. judge pass rates
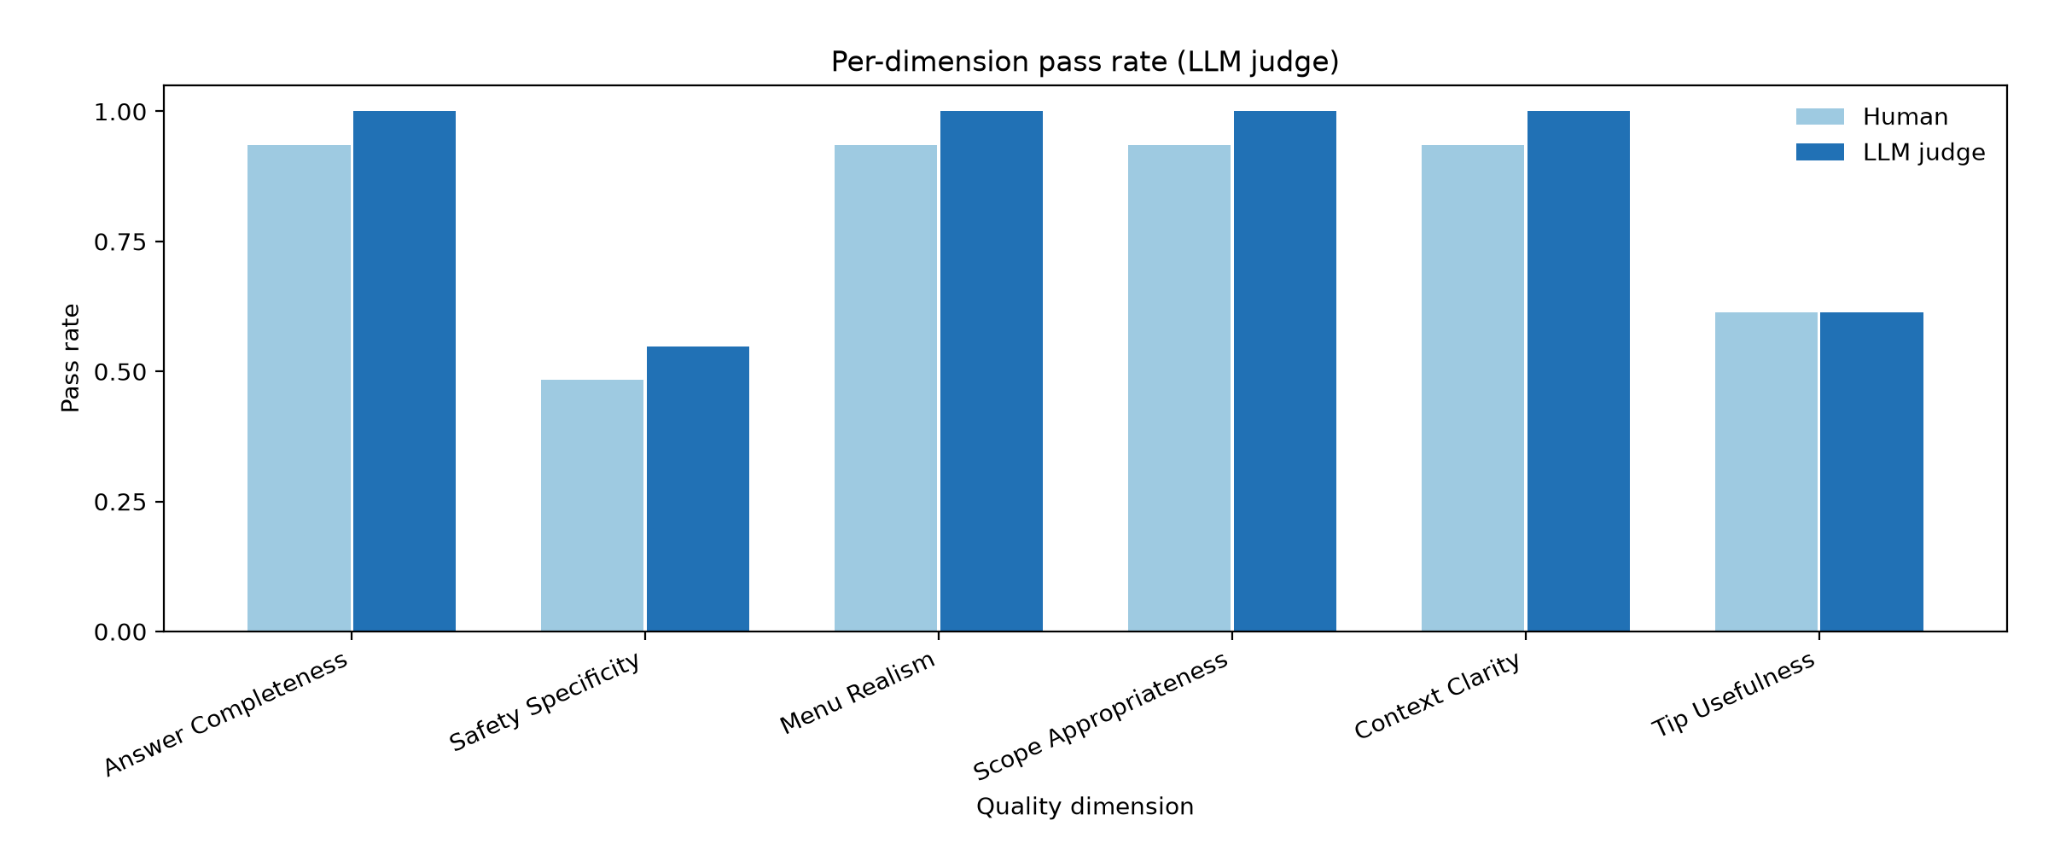
This plot is related but not identical to agreement. It helps show whether the LLM judge is systematically more lenient or stricter than the human labels on a given dimension. In this project, I treat it as a supporting diagnostic rather than the headline metric. Two systems can have similar pass rates and still disagree on specific items.
Figure 3 — Segment heatmap by category
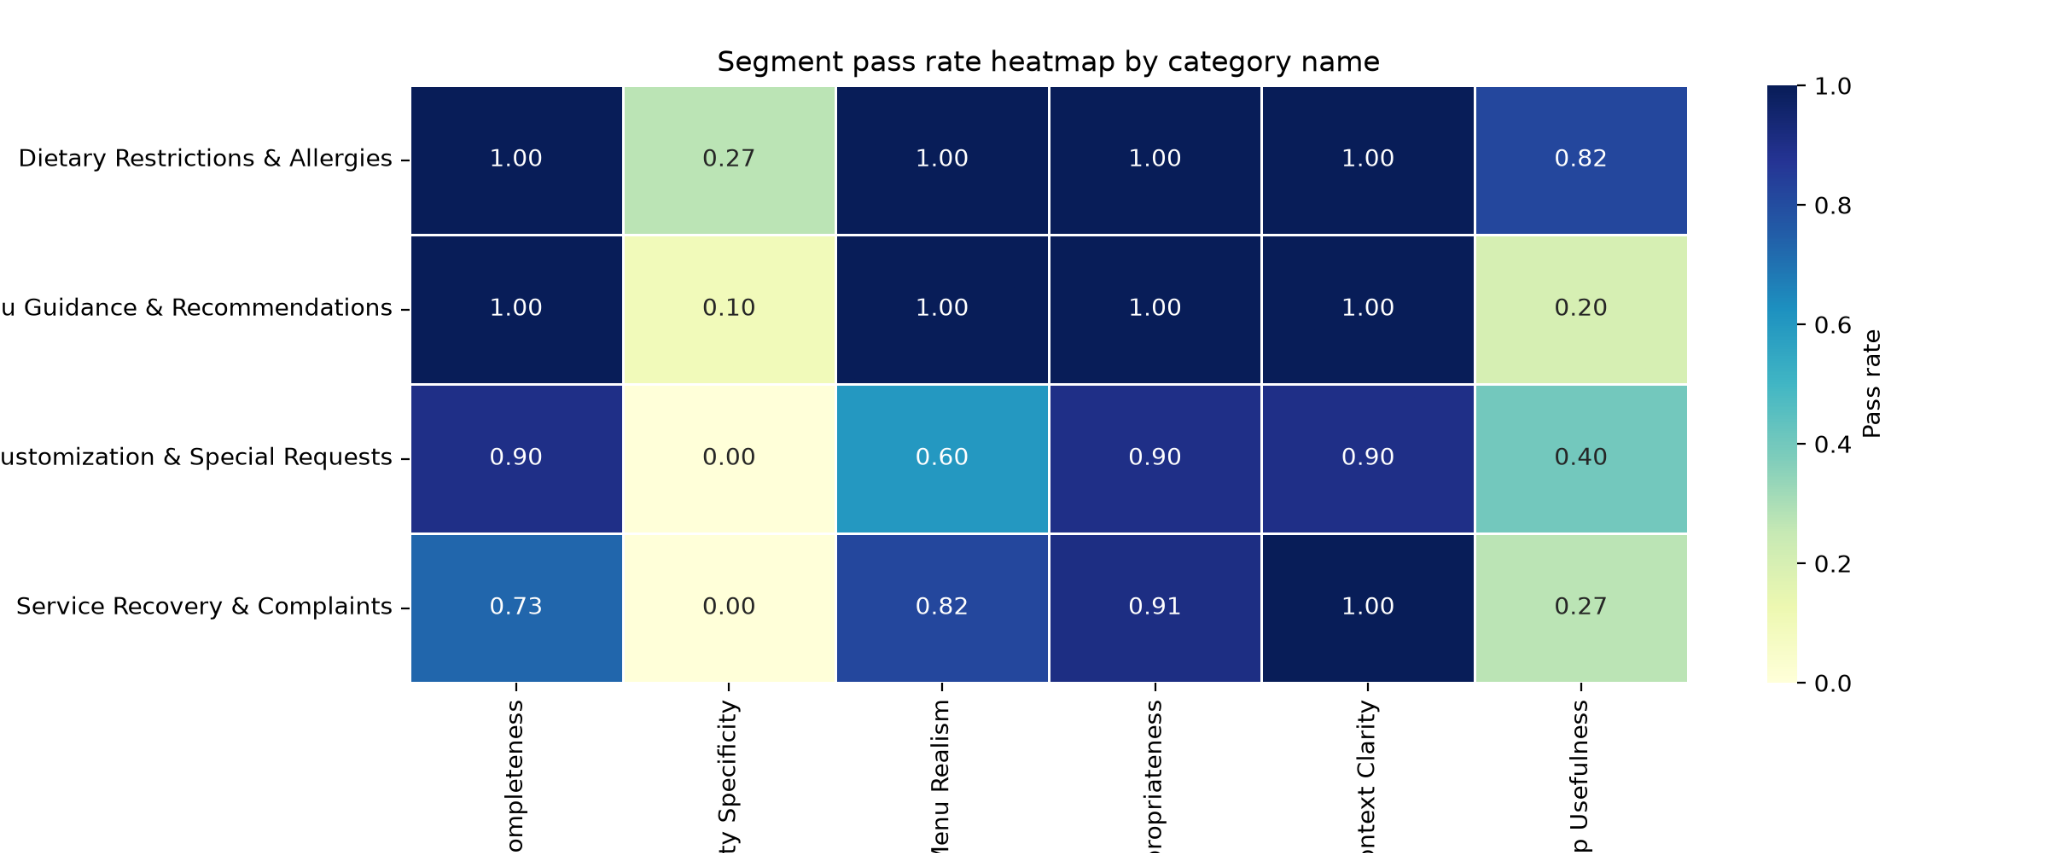
The heatmap is one of the most operationally useful views. It shows that the hardest failures were not evenly distributed. In this run, safety_specificity and tip_usefulness were especially weak in categories like Menu Guidance & Recommendations, Order Customization & Special Requests, and Service Recovery & Complaints. That kind of localized signal is what made targeted prompt iteration possible.
Figure 4 — Coverage against a benchmark
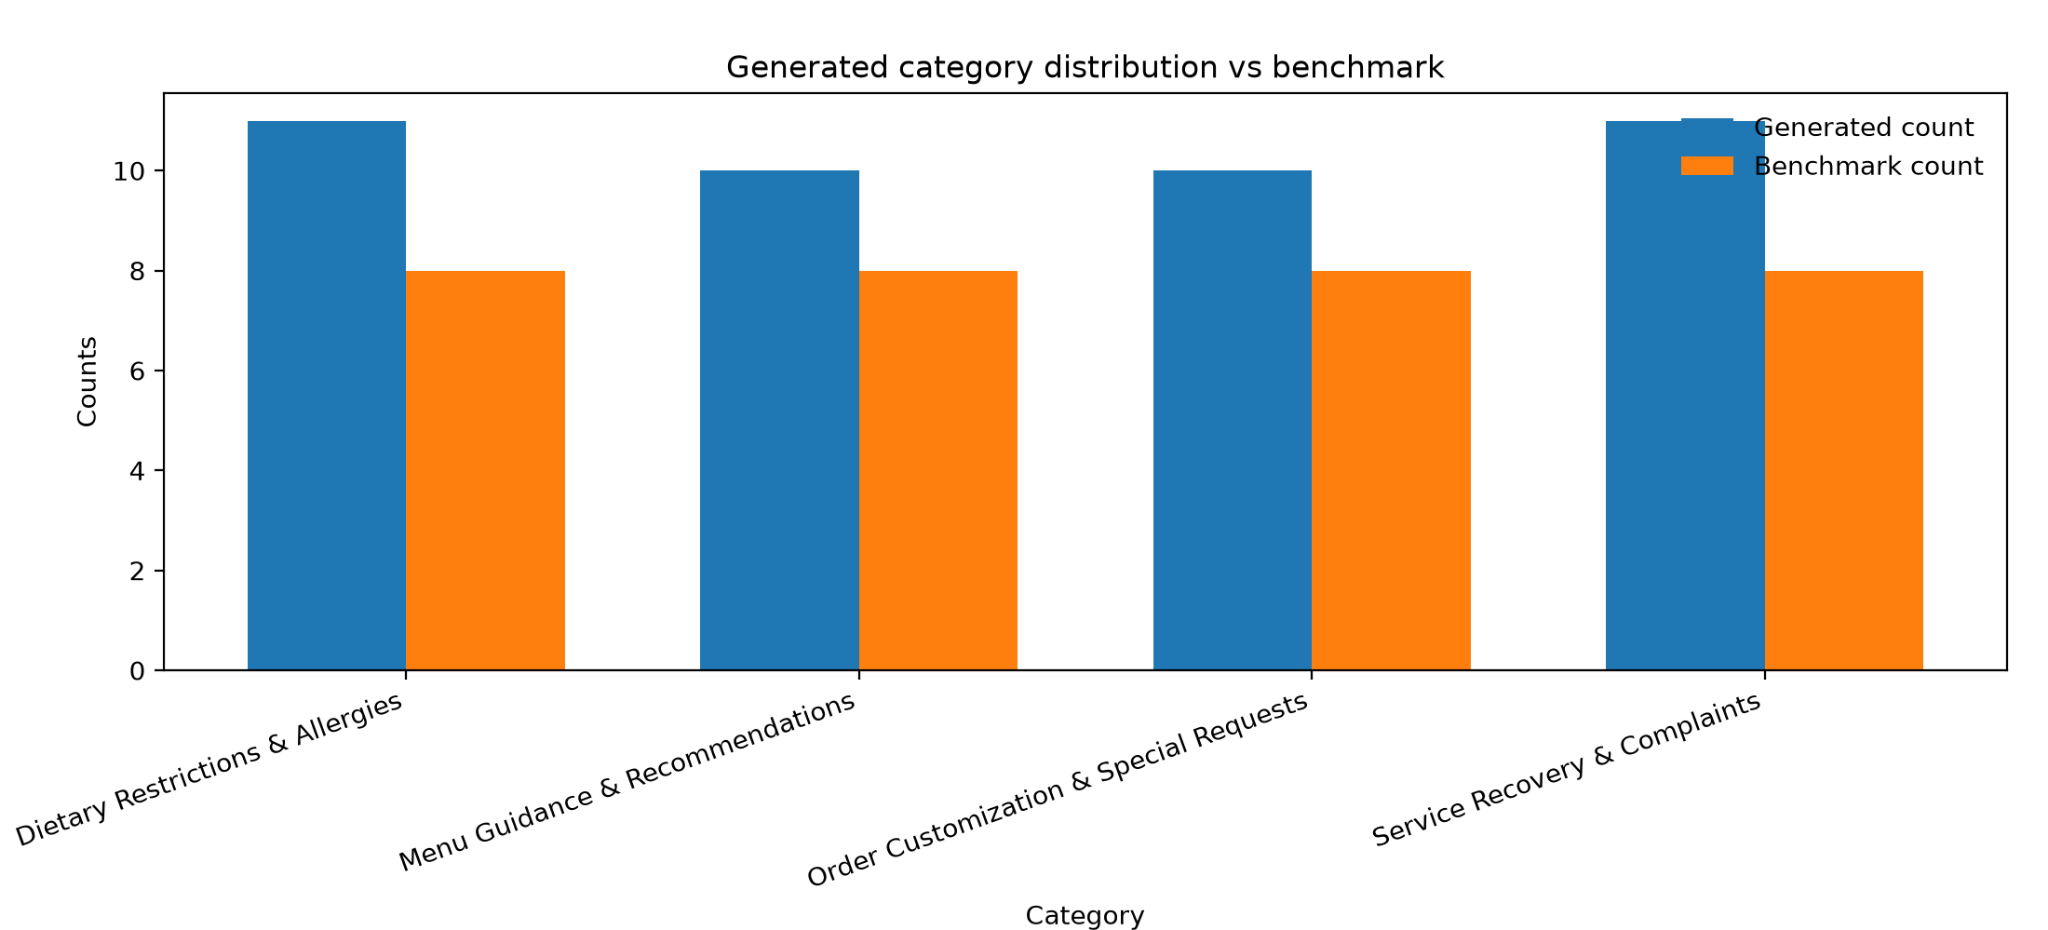
This chart answers a different question: not “Is the data good?” but “Did I generate enough examples across the areas I care about?” I see it as a coverage check. It is useful for architecture decisions because it tells me whether I need better generation control, category balancing, or post-generation filtering. But it does not prove quality or evaluation reliability on its own.
The analysis module contains the plotting functions and generated-output conventions. Charts and JSON summaries are written under visualizations/; see step5_analysis_visualization.py.
One important limitation: the 96.0% result is agreement with labels from one human reviewer on this fixed set. It is not consensus ground truth, a held-out result, or a production reliability guarantee.
6. What I'd do differently
The architecture is intentionally easy to inspect, but it is still an experiment pipeline—not a production service. It runs as a local command-line workflow, stores intermediate results as JSON, and generates charts after the labeling stages. It does not currently provide a serving API, production tracing, or a measured latency/cost dashboard.
I haven't established representative end-to-end latency or cost per generated item, so I won't invent numbers. For the next iteration, I'd record per-stage duration, token usage, retries, validation failures, and estimated API spend alongside each run. I'd also add a held-out evaluation set and a second human reviewer before treating the judge score as stronger evidence.
The main trade-off so far is deliberate: keep the system small enough to iterate quickly, but make its stages, artifacts, prompts, and evaluation criteria explicit enough that failures can be traced and compared.
My takeaway: architecture is not just how components connect. It determines whether an experiment is repeatable, whether a failure can be localized, and whether a metric actually supports the conclusion we want to draw.
About the author
- Software engineer and product builder applying AI to turn ideas into real-world products. I write about AI engineering, experiments, and lessons learned along the way.
Comments
Join the discussionNo comments yet. Be the first to comment.
Building AI Products: Engineering Notes from the Field
Real problems, experiments, trade-offs, and lessons learned while building AI-powered products.